本書的機器學習篇幅全數在第五章,以Scikit-Learn套件實作並介紹:一、機器學習基本術語和概念;二、常見演算法的原理;三、透過各式應用範例,討論如何選擇使用不同的演算法,與各式功能的調整、判斷。讀完此章節之後,對於簡單的資料集,應該有基本的判斷與處理能力,但對於現實應用,則仍有更多的問題有待解決,需要精進技能並結合更多工具才行。
距離上一次張貼資料科學相關網誌已有好幾個月的時間,除了本人生活忙碌,更主要的原因是機器學習對於非資訊、統計相關背景的人來說,是一門不容易駕馭的知識技術,面對如此陡峭的學習曲線,需要投資不少時間與心力理解其中的繁瑣細節,不過所幸本書對於機器學習章節的編排,讓我於研讀的過程,有如初學Python程式語言一般,能夠循序漸進地駕馭這門學問。
第五章:機器學習
深入探究-維度降低-主成分分析(Principal Component Analysis,
PCA)
l 成分(Components)用來定義向量的方向,已解釋變異量(Explained Variance)則用來定義向量的平方長度:
import numpy as np
import matplotlib.pyplot as plt
import seaborn as sns; sns.set()
# 資料
rng = np.random.RandomState(0)
X = np.dot(rng.rand(2, 2), rng.randn(2, 200)).T
# 套用Estimator
from sklearn.decomposition import PCA
model = PCA(n_components = 2)
model.fit(X)
print("Components:\n", model.components_)
print("Explained Variance:\n", model.explained_variance_)
# 繪圖
def draw_vector(v0, v1):
ax = plt.gca()
arrowprops = dict(arrowstyle = "->", linewidth = 2)
ax.annotate("", v1, v0, arrowprops = arrowprops)
plt.scatter(X[:, 0], X[:, 1], alpha = 0.25)
for vector, length in zip(model.components_, model.explained_variance_):
v = vector * 3 * np.sqrt(length)
draw_vector(model.mean_, model.mean_ + v)
plt.show()
l 使用主成分分析進行降維:
import numpy as np
import matplotlib.pyplot as plt
import seaborn as sns; sns.set()
# 資料
rng = np.random.RandomState(0)
X = np.dot(rng.rand(2, 2), rng.randn(2, 200)).T
# 套用Estimator
from sklearn.decomposition import PCA
model = PCA(n_components = 1)
X_projected = model.fit(X).transform(X)
X_new = model.inverse_transform(X_projected)
print("Original Shape:\n", X.shape)
print("Transformed Shape:\n", X_projected.shape)
# 繪圖
plt.scatter(X[:, 0], X[:, 1], alpha = 0.25)
plt.scatter(X_new[:, 0], X_new[:, 1], alpha = 0.25)
plt.show()
l 已解釋變異量比例(Explained Variance Ratio)告訴我們適合的成分數量:
import numpy as np
import matplotlib.pyplot as plt
import seaborn as sns; sns.set()
# 資料
from sklearn.datasets import load_digits
digits = load_digits()
# 套用Estimator
from sklearn.decomposition import PCA
model = PCA()
model.fit(digits.data)
# 繪圖
plt.plot(np.cumsum(model.explained_variance_ratio_))
plt.xlabel("Number of Components")
plt.ylabel("Cumulative Explained Variance")
plt.show()
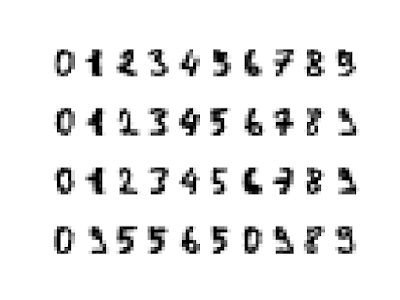
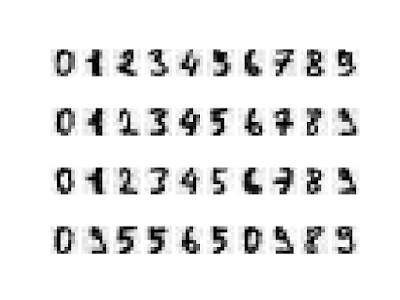
l 使用主成分分析進行雜訊過濾:
import numpy as np
import matplotlib.pyplot as plt
import seaborn as sns; sns.set()
# 原始圖資料
from sklearn.datasets import load_digits
digits = load_digits()
# 雜訊圖資料
np.random.seed(0)
noisy = np.random.normal(digits.data, 0.5)
# 套用Estimator,保留60%變異量
from sklearn.decomposition import PCA
model = PCA(n_components = 0.6)
noisy_projected = model.fit(noisy).transform(noisy)
noisy_new = model.inverse_transform(noisy_projected)
print("Number of Components:\n", model.n_components_)
# 繪圖
def plot_digits(data):
fig, ax = plt.subplots(4, 10, subplot_kw = {"xticks": [], "yticks": []}, gridspec_kw = dict(hspace = 0.1, wspace = 0.1))
for i, axi in enumerate(ax.flat):
axi.imshow(data[i].reshape(8, 8), cmap = "binary")
plt.show()
# 繪出原始圖
plot_digits(digits.data)
# 繪出雜訊圖
plot_digits(noisy)
# 繪出雜訊圖過濾結果
plot_digits(noisy_new)
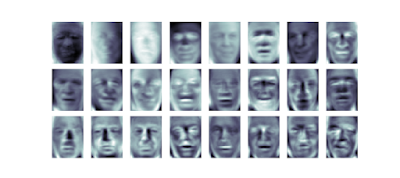
l 範例-特徵臉孔:
import matplotlib.pyplot as plt
import seaborn as sns; sns.set()
# 資料
from sklearn.datasets import fetch_lfw_people
faces = fetch_lfw_people(min_faces_per_person = 60)
# 套用Estimator
from sklearn.decomposition import PCA
model = PCA(n_components = 150)
model.fit(faces.data)
faces_projected = model.transform(faces.data)
faces_new = model.inverse_transform(faces_projected)
# 繪圖
# 繪出特徵臉孔
fig, ax = plt.subplots(3, 8, figsize = (9, 4), subplot_kw = {"xticks": [], "yticks": []}, gridspec_kw = dict(hspace = 0.1, wspace = 0.1))
for i, axi in enumerate(ax.flat):
axi.imshow(model.components_[i].reshape(62, 47), cmap = "bone")
plt.show()
# 繪出原始臉孔與特徵臉孔重組之對比
fig, ax = plt.subplots(2, 10, figsize = (10, 2.5), subplot_kw = {"xticks": [], "yticks": []}, gridspec_kw = dict(hspace = 0.1, wspace = 0.1))
for i in range(10):
ax[0, i].imshow(faces.data[i].reshape(62, 47), cmap = "binary_r")
ax[1, i].imshow(faces_new[i].reshape(62, 47), cmap = "binary_r")
ax[0, 0].set_ylabel("Full-dim\nInput")
ax[1, 0].set_ylabel("150-dim\nReconstruction")
plt.show()
l 使用主成分分析的優缺點:
優點一-簡易直觀且有效地深入觀察高維度資料
缺點一-容易被資料中的異常值所影響
缺點二-資料之間有非線性關係時表現結果不佳
優點一-簡易直觀且有效地深入觀察高維度資料
缺點一-容易被資料中的異常值所影響
缺點二-資料之間有非線性關係時表現結果不佳
深入探究-維度降低-流形學習(Manifold Learning)
l 等距特徵映射(Isomap):
import matplotlib.pyplot as plt
import seaborn as sns; sns.set()
# 資料
from sklearn.datasets import load_digits
digits = load_digits()
X = digits.data
y = digits.target
# 套用Estimator
from sklearn.manifold import Isomap
model = Isomap(n_components = 2)
X_projected = model.fit(X).transform(X)
# 繪圖
plt.scatter(X_projected[:, 0], X_projected[:, 1], c = y, edgecolor = "none", alpha = 0.5, cmap = plt.cm.get_cmap("cubehelix", 10))
plt.colorbar(label = "Digit Label", ticks = range(10))
plt.clim(-0.5, 9.5)
plt.show()
l 給予多維標度(Multidimensional Scaling, MDS)每點之間的距離矩陣就可以回復資料,為多維度座標表示法:
import numpy as np
import matplotlib.pyplot as plt
import seaborn as sns; sns.set()
# 原始圖資料
def make_hello(N = 1000, rseed = 0):
# 畫出HELLO圖形,並存成一個PNG檔
fig, ax = plt.subplots(figsize = (4, 1))
fig.subplots_adjust(left = 0, right = 1, bottom = 0, top = 1)
ax.axis("off")
ax.text(0.5, 0.4, "HELLO", va = "center", ha = "center", weight = "bold", size = 85)
fig.savefig("hello.png")
plt.close(fig)
# 開啟這個400*100像素的PNG檔,並從中畫出N個隨機點
from matplotlib.image import imread
data = imread("hello.png")[::-1, :, 0].T
rng = np.random.RandomState(rseed)
X = rng.rand(4 * N, 2)
i, j = (X * data.shape).astype(int).T
mask = (data[i, j] < 1)
X = X[mask]
X[:, 0] *= (data.shape[0] / data.shape[1])
X = X[:N]
return X[np.argsort(X[:, 0])]
X = make_hello(1000)
colorize = dict(c = X[:, 0], cmap = plt.cm.get_cmap("rainbow", 5))
# 繪出原始圖
plt.scatter(X[:, 0], X[:, 1], **colorize)
plt.axis("equal")
plt.show()
# 旋轉原始圖資料
def rotate(X, angle):
# 使用弧度與三角函數計算
theta = np.deg2rad(angle)
R = [[np.cos(theta), np.sin(theta)], [-np.sin(theta), np.cos(theta)]]
return np.dot(X, R)
X2 = rotate(X, 20) + 5
# 繪出旋轉原始圖
plt.scatter(X2[:, 0], X2[:, 1], **colorize)
plt.axis("equal")
plt.show()
# 套用Estimator
# 原始圖與旋轉原始圖的距離矩陣資料
from sklearn.metrics import pairwise_distances
D = pairwise_distances(X)
print(D.shape)
D2 = pairwise_distances(X2)
print(D2.shape)
print(np.allclose(D, D2))
# 多維標度
from sklearn.manifold import MDS
model = MDS(n_components = 2, dissimilarity = "precomputed", random_state = 0)
X_projected = model.fit_transform(D)
# 繪圖
plt.scatter(X_projected[:, 0], X_projected[:, 1], **colorize)
plt.axis("equal")
plt.show()
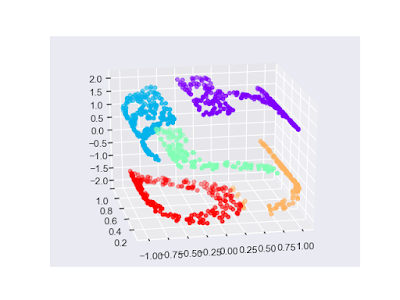
l 所謂的線性嵌入就是旋轉、平移、縮放資料到高維度的空間中,而MDS不能應用於非線性嵌入(Nonlinear Embeddings):
import numpy as np
import matplotlib.pyplot as plt
import seaborn as sns; sns.set()
# 原始圖資料
def make_hello(N = 1000, rseed = 0):
# 畫出HELLO圖形,並存成一個PNG檔
fig, ax = plt.subplots(figsize = (4, 1))
fig.subplots_adjust(left = 0, right = 1, bottom = 0, top = 1)
ax.axis("off")
ax.text(0.5, 0.4, "HELLO", va = "center", ha = "center", weight = "bold", size = 85)
fig.savefig("hello.png")
plt.close(fig)
# 開啟這個400*100像素的PNG檔,並從中畫出N個隨機點
from matplotlib.image import imread
data = imread("hello.png")[::-1, :, 0].T
rng = np.random.RandomState(rseed)
X = rng.rand(4 * N, 2)
i, j = (X * data.shape).astype(int).T
mask = (data[i, j] < 1)
X = X[mask]
X[:, 0] *= (data.shape[0] / data.shape[1])
X = X[:N]
return X[np.argsort(X[:, 0])]
X = make_hello(1000)
colorize = dict(c = X[:, 0], cmap = plt.cm.get_cmap("rainbow", 5))
# 繪出原始圖
plt.scatter(X[:, 0], X[:, 1], **colorize)
plt.axis("equal")
plt.show()
# 三維S型原始圖資料
def make_hello_s_curve(X):
t = (X[:, 0] - 2) * 0.75 * np.pi
x = np.sin(t)
y = X[:, 1]
z = np.sign(t) * (np.cos(t) - 1)
return np.vstack((x, y, z)).T
X3 = make_hello_s_curve(X)
# 繪出三維S型原始圖
from mpl_toolkits import mplot3d
ax = plt.axes(projection = "3d")
ax.scatter3D(X3[:, 0], X3[:, 1], X3[:, 2], **colorize)
plt.show()
# 套用Estimator
from sklearn.manifold import MDS
model = MDS(n_components = 2, random_state = 0)
X3_projected = model.fit_transform(X3)
# 繪圖
plt.scatter(X3_projected[:, 0], X3_projected[:, 1], **colorize)
plt.axis("equal")
plt.show()
l 遇到非線性流形(Nonlinear Manifolds)情境,改用區域線性嵌入(Locally
Linear Embedding, LLE),只保留比較近的點之間的距離:
import numpy as np
import matplotlib.pyplot as plt
import seaborn as sns; sns.set()
# 原始圖資料
def make_hello(N = 1000, rseed = 0):
# 畫出HELLO圖形,並存成一個PNG檔
fig, ax = plt.subplots(figsize = (4, 1))
fig.subplots_adjust(left = 0, right = 1, bottom = 0, top = 1)
ax.axis("off")
ax.text(0.5, 0.4, "HELLO", va = "center", ha = "center", weight = "bold", size = 85)
fig.savefig("hello.png")
plt.close(fig)
# 開啟這個400*100像素的PNG檔,並從中畫出N個隨機點
from matplotlib.image import imread
data = imread("hello.png")[::-1, :, 0].T
rng = np.random.RandomState(rseed)
X = rng.rand(4 * N, 2)
i, j = (X * data.shape).astype(int).T
mask = (data[i, j] < 1)
X = X[mask]
X[:, 0] *= (data.shape[0] / data.shape[1])
X = X[:N]
return X[np.argsort(X[:, 0])]
X = make_hello(1000)
colorize = dict(c = X[:, 0], cmap = plt.cm.get_cmap("rainbow", 5))
# 繪出原始圖
plt.scatter(X[:, 0], X[:, 1], **colorize)
plt.axis("equal")
plt.show()
# 三維S型原始圖資料
def make_hello_s_curve(X):
t = (X[:, 0] - 2) * 0.75 * np.pi
x = np.sin(t)
y = X[:, 1]
z = np.sign(t) * (np.cos(t) - 1)
return np.vstack((x, y, z)).T
X3 = make_hello_s_curve(X)
# 繪出三維S型原始圖
from mpl_toolkits import mplot3d
ax = plt.axes(projection = "3d")
ax.scatter3D(X3[:, 0], X3[:, 1], X3[:, 2], **colorize)
plt.show()
# 套用Estimator
from sklearn.manifold import LocallyLinearEmbedding
model = LocallyLinearEmbedding(n_neighbors = 100, n_components = 2, method = "modified", eigen_solver = "dense")
X3_projected = model.fit_transform(X3)
# 繪圖
plt.scatter(X3_projected[:, 0], X3_projected[:, 1], **colorize)
plt.axis("equal")
plt.show()
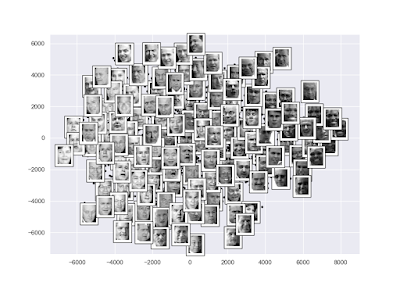
l 範例-在臉部辨識上使用等距特徵映射(Isomap):
import numpy as np
import matplotlib.pyplot as plt
import seaborn as sns; sns.set()
# 資料
from sklearn.datasets import fetch_lfw_people
faces = fetch_lfw_people(min_faces_per_person = 30)
# 套用Estimator
from sklearn.manifold import Isomap
model = Isomap(n_components = 2)
faces_projected = model.fit_transform(faces.data)
# 繪圖
fig, ax = plt.subplots(figsize = (10, 10))
ax.plot(faces_projected[:, 0], faces_projected[:, 1], ".k")
from matplotlib import offsetbox
shown_images = np.array([2 * faces_projected.max(0)])
min_dist = (0.05 * max(faces_projected.max(0) - faces_projected.min(0))) ** 2
for i in range(faces.data.shape[0]):
dist = np.sum((faces_projected[i] - shown_images) ** 2, 1)
if np.min(dist) < min_dist:
# 不要顯示太過接近的點
continue
shown_images = np.vstack([shown_images, faces_projected[i]])
imagebox = offsetbox.AnnotationBbox(offsetbox.OffsetImage(faces.images[:, ::2, ::2][i], cmap = "gray"), faces_projected[i])
ax.add_artist(imagebox)
plt.show()
l 使用流形學習的優缺點:
優點一-有能力去保留資料中的非線性關係
和主成分分析相比,全都比較差:
缺點一-沒有好的框架可以用來處理缺失資料
缺點二-雜訊會讓複本短路以至於徹底地改變內嵌內容
缺點三-沒有強健量化方法告訴我們最佳近鄰數是多少
缺點四-非常難決定總體最佳輸出維度的數目
缺點五-流形學習內嵌維度的意義不總是清楚
缺點六-流形學習的計算成本較高
優點一-有能力去保留資料中的非線性關係
和主成分分析相比,全都比較差:
缺點一-沒有好的框架可以用來處理缺失資料
缺點二-雜訊會讓複本短路以至於徹底地改變內嵌內容
缺點三-沒有強健量化方法告訴我們最佳近鄰數是多少
缺點四-非常難決定總體最佳輸出維度的數目
缺點五-流形學習內嵌維度的意義不總是清楚
缺點六-流形學習的計算成本較高
深入探究-集群-k-平均集群法(k-means Clustering)
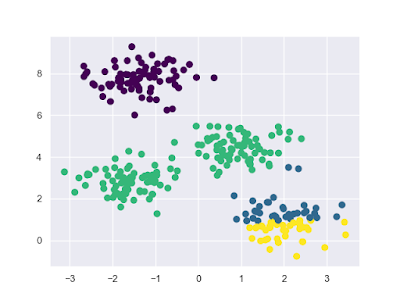
l k-平均集群法範例一-同一群組中所有點的算數平均是群組中心,且同一群組中所有點都比其它群組的點還要接近群組中心:
import matplotlib.pyplot as plt
import seaborn as sns; sns.set()
# 資料
from sklearn.datasets.samples_generator import make_blobs
X, y = make_blobs(n_samples = 300, centers = 4, random_state = 0, cluster_std = 0.6)
# 套用Estimator
from sklearn.cluster import KMeans
model = KMeans(n_clusters = 4, random_state = 0)
y_fit = model.fit(X).predict(X)
# 繪圖
plt.scatter(X[:, 0], X[:, 1], c = y_fit, s = 50, cmap = "viridis")
centers = model.cluster_centers_
plt.scatter(centers[:, 0], centers[:, 1], c = "black", s = 200, alpha = 0.5)
plt.show()
l k-平均集群法範例二-k-平均演算法為最大期望算法(Expectation-maximization):
import numpy as np
import matplotlib.pyplot as plt
import seaborn as sns; sns.set()
# 資料
from sklearn.datasets.samples_generator import make_blobs
X, y = make_blobs(n_samples = 300, centers = 4, random_state = 0, cluster_std = 0.6)
# 最大期望算法
from sklearn.metrics import pairwise_distances_argmin
def find_clusters(X, n_clusters, rseed = 2):
# Step1. 隨機猜測群組的中心
rng = np.random.RandomState(rseed)
num = rng.permutation(X.shape[0])[:n_clusters]
centers = X[num]
while True:
# Step2a. E-Step(Expectation Step)以最近的群組中心設定標籤
labels = pairwise_distances_argmin(X, centers)
# Step2b. M-Step(Maximization Step)設定點的平均為新的群組中心
new_centers = np.array([X[labels == i].mean(0) for i in range(n_clusters)])
# Step2c. 檢查是否收斂
if np.all(centers == new_centers):
break
centers = new_centers
return centers, labels
# 繪圖
centers, labels = find_clusters(X, 4)
plt.scatter(X[:, 0], X[:, 1], c = labels, s = 50, cmap = "viridis")
plt.show()
l 使用k-平均集群法的警示一-
最大期望算法可能無法達到全體最佳化的結果,因此此演算法經常執行多次,以n_init預設為10:
# 不佳範例,修改k-平均集群法範例二的隨機種子
centers, labels = find_clusters(X, 4, rseed = 0)
最大期望算法可能無法達到全體最佳化的結果,因此此演算法經常執行多次,以n_init預設為10:
# 不佳範例,修改k-平均集群法範例二的隨機種子
centers, labels = find_clusters(X, 4, rseed = 0)
l 使用k-平均集群法的警示二-
必須事先設定群組數目:
# 不佳範例,修改k-平均集群法範例一的群組數目
model = KMeans(n_clusters = 6, random_state = 0)
必須事先設定群組數目:
# 不佳範例,修改k-平均集群法範例一的群組數目
model = KMeans(n_clusters = 6, random_state = 0)
l 使用k-平均集群法的警示三-
k-平均被限制在線性群組邊界:
import matplotlib.pyplot as plt
import seaborn as sns; sns.set()
# 資料
from sklearn.datasets import make_moons
X, y = make_moons(n_samples = 200, noise = 0.05, random_state = 0)
# 不佳範例,套用Estimator
from sklearn.cluster import KMeans
model = KMeans(n_clusters = 2, random_state = 0)
y_fit = model.fit(X).predict(X)
# 繪圖
plt.scatter(X[:, 0], X[:, 1], c = y_fit, s = 50, cmap = "viridis")
centers = model.cluster_centers_
plt.scatter(centers[:, 0], centers[:, 1], c = "black", s = 200, alpha = 0.5)
plt.show()
l 使用k-平均集群法的警示三-解法-
讓k-平均也可以找出非線性的邊界:
import matplotlib.pyplot as plt
import seaborn as sns; sns.set()
# 資料
from sklearn.datasets import make_moons
X, y = make_moons(n_samples = 200, noise = 0.05, random_state = 0)
# 套用Estimator
from sklearn.cluster import SpectralClustering
model = SpectralClustering(n_clusters = 2, affinity = "nearest_neighbors")
y_fit = model.fit_predict(X)
# 繪圖
plt.scatter(X[:, 0], X[:, 1], c = y_fit, s = 50, cmap = "viridis")
plt.show()
l 使用k-平均集群法的警示四-
大量的樣本會讓k-平均執行變慢。
大量的樣本會讓k-平均執行變慢。
l 使用k-平均集群法的警示五-
套用k-平均的集群模型必須是圓形,若非圓形可使用主成分分析預處理,但不保證效果好,否則必須使用高斯混合模型(Gaussian Mixture Models, GMM):
import matplotlib.pyplot as plt
import seaborn as sns; sns.set()
# 資料
from sklearn.datasets.samples_generator import make_blobs
X, y = make_blobs(n_samples = 400, centers = 4, random_state = 0, cluster_std = 0.6)
# 套用Estimator
from sklearn.cluster import KMeans
model = KMeans(n_clusters = 4, random_state = 0)
y_fit = model.fit(X).predict(X)
# 繪圖
ax = plt.gca()
ax.axis("equal")
ax.scatter(X[:, 0], X[:, 1], c = y_fit, cmap = "viridis")
from scipy.spatial.distance import cdist
centers = model.cluster_centers_
radii = [cdist(X[y_fit == i], [center]).max() for i, center in enumerate(centers)]
for c, r in zip(centers, radii):
ax.add_patch(plt.Circle(c, r, fc = "#CCCCCC", alpha = 0.3))
plt.show()
l 範例一-搭配流形學習t-SNE演算法(t-distributed Stochastic Neighbor Embedding),在數字元上使用k-平均:
import numpy as np
import matplotlib.pyplot as plt
import seaborn as sns; sns.set()
# 資料
from sklearn.datasets import load_digits
digits = load_digits()
# 套用Estimator
from sklearn.manifold import TSNE
model_tsne = TSNE(n_components = 2, init = "pca", random_state = 0)
digits_projected = model_tsne.fit_transform(digits.data)
from sklearn.cluster import KMeans
model_kmeans = KMeans(n_clusters = 10, random_state = 0)
digits_fit = model_kmeans.fit(digits_projected).predict(digits_projected)
# 找出各群組實際標籤之眾數(mode)來訂定各群組所代表之數字
from scipy.stats import mode
labels = np.zeros_like(digits_fit)
for i in range(10):
mask = (digits_fit == i)
labels[mask] = mode(digits.target[mask])[0]
# 準確率
from sklearn.metrics import accuracy_score
print(accuracy_score(digits.target, labels))
# 繪圖
from sklearn.metrics import confusion_matrix
mat = confusion_matrix(digits.target, labels)
sns.heatmap(mat.T, square = True, annot = True, fmt = "d", cbar = False, xticklabels = digits.target_names, yticklabels = digits.target_names)
plt.xlabel("True Label")
plt.ylabel("Predicted Label")
plt.show()
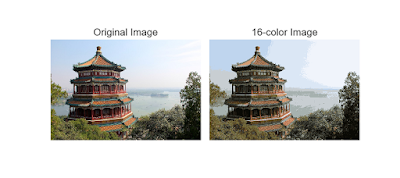
l 範例二-在色彩壓縮使用k-平均:
import matplotlib.pyplot as plt
import seaborn as sns; sns.set()
# 資料,需安裝過pillow套件
from sklearn.datasets import load_sample_image
china = load_sample_image("china.jpg")
# 數值尺度改為0至1之間,並重塑為[n_samples * n_features]
data = china / 255
data = data.reshape(427 * 640, 3)
# 套用Estimator,使用迷你批次k-平均(Mini Batch k-means)比標準的k-平均快,在像素空間減少到16色
from sklearn.cluster import MiniBatchKMeans
model = MiniBatchKMeans(n_clusters = 16)
data_new_colors = model.fit(data).predict(data)
new_colors = model.cluster_centers_[data_new_colors]
china_recolored = new_colors.reshape(china.shape)
# 繪圖
fig, ax = plt.subplots(1, 2, figsize = (9, 4), subplot_kw = {"xticks": [], "yticks": []}, gridspec_kw = dict(wspace = 0.05))
ax[0].imshow(china)
ax[0].set_title("Original Image", size = 16)
ax[1].imshow(china_recolored)
ax[1].set_title("16-color Image", size = 16)
plt.show()
深入探究-集群-高斯混合模型(Gaussian Mixture Models,
GMM)
l k-平均的集群模型必須是圓形,缺乏在群組形狀上的彈性,也缺乏機率集群的指定,而高斯混合模型正好可以解決這兩個缺點,尋找一個多維度高斯機率分布的混合體,如此一來可以處理不是圓形的集群模型如橢圓:
import numpy as np
import matplotlib.pyplot as plt
import seaborn as sns; sns.set()
# 資料
from sklearn.datasets.samples_generator import make_blobs
X, y = make_blobs(n_samples = 400, centers = 4, random_state = 0, cluster_std = 0.6)
rng = np.random.RandomState(13)
X_stretched = np.dot(X, rng.randn(2, 2))
# 套用Estimator
from sklearn.mixture import GaussianMixture
model = GaussianMixture(n_components = 4, random_state = 1)
y_fit = model.fit(X_stretched).predict(X_stretched)
# 機率-[n_samples, n_clusters]
probs = model.predict_proba(X_stretched)
print(probs[:5].round(3))
# 繪圖
ax = plt.gca()
ax.axis("equal")
ax.scatter(X_stretched[:, 0], X_stretched[:, 1], c = y_fit, cmap = "viridis")
from matplotlib.patches import Ellipse
def draw_ellipse(position, covariance, **kwargs):
# 線性代數之奇異值分解(Singular Value Decomposition)
if covariance.shape == (2, 2):
U, s, Vt = np.linalg.svd(covariance)
angle = np.degrees(np.arctan2(U[1, 0], U[0, 0]))
width, height = 2 * np.sqrt(s)
else:
angle = 0
width, height = 2 * np.sqrt(covariance)
for nsig in range(1, 4):
ax.add_patch(Ellipse(position, nsig * width, nsig * height, angle, **kwargs))
w_factor = 0.2 / model.weights_.max()
for pos, covar, w in zip(model.means_, model.covariances_, model.weights_):
draw_ellipse(pos, covar, alpha = w * w_factor)
plt.show()
l 高斯混合模型演算法為最大期望算法(Expectation-maximization):
Step1. 選擇一開始猜測的位置和形狀
Step2. 重複直到收斂
Step2a. E-step對於每一個點,找出在每一個群之中為其成員的機率
Step2b. M-step對於每一個群,以所有點為基礎,更新位置、常規、形狀
Step1. 選擇一開始猜測的位置和形狀
Step2. 重複直到收斂
Step2a. E-step對於每一個點,找出在每一個群之中為其成員的機率
Step2b. M-step對於每一個群,以所有點為基礎,更新位置、常規、形狀
l 把高斯混合模型(GMM)視為密度計算(Density Estimation),因GMM擬合的結果在技術上並不是一個集群模型,而是一個用來描述資料分布的生成機率模型(Generative
Probabilistic Model):
import matplotlib.pyplot as plt
import seaborn as sns; sns.set()
# 資料
from sklearn.datasets import make_moons
X, y = make_moons(n_samples = 200, noise = 0.05, random_state = 0)
# 套用Estimator
from sklearn.mixture import GaussianMixture
model = GaussianMixture(n_components = 16, random_state = 0)
y_fit = model.fit(X).predict(X)
# 從16-components GMM產生之400個新資料點
data_new = model.sample(400)
# 繪圖
fig, ax = plt.subplots(1, 2, figsize = (9, 4))
for axi, ti, xi, yi in zip(ax.flat, ["Original", "New"], [X, data_new[0]], [y_fit, data_new[1]]):
axi.axis("equal")
axi.set_title(ti)
axi.scatter(xi[:, 0], xi[:, 1], c = yi, cmap = "viridis", s = 5)
plt.show()
l 建議使用AIC或BIC的最小值做為高斯混合模型(GMM)的最佳群組數目,此外作者也建議只有在簡單的資料集中才把GMM當作集群方法使用:
import numpy as np
import matplotlib.pyplot as plt
import seaborn as sns; sns.set()
# 資料
from sklearn.datasets import make_moons
X, y = make_moons(n_samples = 200, noise = 0.05, random_state = 0)
# 套用Estimator
from sklearn.mixture import GaussianMixture
n_components = np.arange(1, 21)
models = [GaussianMixture(n, random_state = 0).fit(X) for n in n_components]
# 繪圖
plt.plot(n_components, [m.aic(X) for m in models], label = "AIC")
plt.plot(n_components, [m.bic(X) for m in models], label = "BIC")
plt.legend(loc = "best")
plt.xlabel("Number of Components")
plt.show()
l 範例-使用高斯混合模型產生新的手寫數字元:
import matplotlib.pyplot as plt
import seaborn as sns; sns.set()
# 資料
from sklearn.datasets import load_digits
digits = load_digits()
# 套用Estimator,保留99%變異量
from sklearn.decomposition import PCA
model_pca = PCA(n_components = 0.99, whiten = True)
pca_projected = model_pca.fit_transform(digits.data)
# 套用Estimator,估計最小化AIC後選擇使用110
from sklearn.mixture import GaussianMixture
model_gmm = GaussianMixture(n_components = 110, random_state = 0)
model_gmm.fit(pca_projected)
# 產生100個新的手寫數字元
data_new = model_gmm.sample(100)
digits_new = model_pca.inverse_transform(data_new[0])
# 繪圖,新的手寫數字元
fig, ax = plt.subplots(10, 10, subplot_kw = dict(xticks = [], yticks = []), gridspec_kw = dict(hspace = 0.05, wspace = 0.05))
for i, axi in enumerate(ax.flat):
im = axi.imshow(digits_new[i].reshape(8, 8), cmap = "binary")
im.set_clim(0, 16)
plt.show()
深入探究-核密度估計(Kernel Density Estimation, KDE)
l 直方圖-核密度估計的使用動機,使用每一個資料點的高斯元件混合,產生出一個無母體的密度評估結果:
import numpy as np
import matplotlib.pyplot as plt
import seaborn as sns; sns.set()
# 資料
def make_data(N, f = 0.3, rseed = 1):
rand = np.random.RandomState(rseed)
x = rand.randn(N)
x[int(f * N):] += 5
return x
x = make_data(20)
x_d = np.linspace(-4, 8, 2000)
# 繪圖,依照資料點堆疊方塊
density = sum((abs(xi - x_d) < 0.5) for xi in x)
plt.fill_between(x_d, density, alpha = 0.5)
plt.plot(x, np.full_like(x, -0.1), "|k", markeredgewidth = 1)
plt.axis([-4, 8, -0.2, 8])
plt.show()
# 繪圖,依照資料點使用正規化曲線取代方塊
from scipy.stats import norm
density = sum(norm(xi).pdf(x_d) for xi in x)
plt.fill_between(x_d, density, alpha = 0.5)
plt.plot(x, np.full_like(x, -0.1), "|k", markeredgewidth = 1)
plt.axis([-4, 8, -0.2, 5])
plt.show()
l 二維直方圖-核密度估計:
import numpy as np
import matplotlib.pyplot as plt
import seaborn as sns; sns.set()
# 資料
mean = [0, 0]
cov = [[1, 1], [1, 2]]
x, y = np.random.multivariate_normal(mean, cov, 10000).T
data = np.vstack([x, y])
# 在一個方形的格子上進行估算
xgrid = np.linspace(-3.5, 3.5, 40)
ygrid = np.linspace(-6, 6, 40)
Xgrid, Ygrid = np.meshgrid(xgrid, ygrid)
# 套用SciPy Estimator API
from scipy.stats import gaussian_kde
model = gaussian_kde(data)
Z = model.evaluate(np.vstack([Xgrid.ravel(), Ygrid.ravel()]))
# 繪圖
plt.imshow(Z.reshape(Xgrid.shape), origin = "lower", aspect = "auto", extent = [-3.5, 3.5, -6, 6], cmap = "Blues")
cb = plt.colorbar()
cb.set_label("Density")
plt.show()
l 核心(Kernel)是用來指定每一個點所放置的分佈形狀,核心帶寬(Kernel Bandwidth)則是用來控制每一個點的核心大小,太過窄的帶寬可能會過度擬合,太過寬的帶寬可能會擬合不足:
import numpy as np
import matplotlib.pyplot as plt
import seaborn as sns; sns.set()
# 資料
def make_data(N, f = 0.3, rseed = 1):
rand = np.random.RandomState(rseed)
x = rand.randn(N)
x[int(f * N):] += 5
return x
x = make_data(20)
x_d = np.linspace(-4, 8, 2000)
# 套用Estimator,格狀搜尋
from sklearn.model_selection import GridSearchCV
from sklearn.neighbors import KernelDensity
from sklearn.model_selection import LeaveOneOut
bandwidths = 10 ** np.linspace(-1, 1, 100)
grid = GridSearchCV(KernelDensity(kernel = "gaussian"), {"bandwidth": bandwidths}, cv = LeaveOneOut())
grid.fit(x[:, None])
print(grid.best_params_)
model = grid.best_estimator_
model.fit(x[:, None])
# 傳回機率密度對數(log)
log_probs = model.score_samples(x_d[:, None])
# 繪圖
plt.fill_between(x_d, np.exp(log_probs), alpha = 0.5)
plt.plot(x, np.full_like(x, -0.01), "|k", markeredgewidth = 1)
plt.ylim(-0.02, 0.22)
plt.show()
深入探究-方向梯度直方圖(Histogram of Oriented
Gradients, HOG)
l 特徵擷取,將像素轉換成向量:
import numpy as np
import matplotlib.pyplot as plt
import seaborn as sns; sns.set()
# 資料,需安裝scikit-image套件
from skimage import color, data
image = color.rgb2gray(data.chelsea())
# 套用Scikit-image Estimator API,萃取特徵
from skimage import feature
hog_vec, hog_vis = feature.hog(image, visualise = True)
# 繪圖
fig, ax = plt.subplots(1, 2, figsize = (9, 4), subplot_kw = dict(xticks = [], yticks = []))
ax[0].imshow(image, cmap = "gray")
ax[0].set_title("Input Image")
ax[1].imshow(hog_vis)
ax[1].set_title("Visualization of HOG Features")
plt.show()
進一步的機器學習資源
l Python中的機器學習:
Scikit-Learn網站(http://scikit-learn.org)
SciPy、PyCon、和PyData教學影片
Introduction to Machine Learning with Python(http://bit.ly/intro-machine-learning-python)
Python Machine Learning(https://www.packtpub.com/big-data-and-business-intelligence/python-machine-learning)
Scikit-Learn網站(http://scikit-learn.org)
SciPy、PyCon、和PyData教學影片
Introduction to Machine Learning with Python(http://bit.ly/intro-machine-learning-python)
Python Machine Learning(https://www.packtpub.com/big-data-and-business-intelligence/python-machine-learning)
l 一般的機器學習:
機器學習(https://www.coursera.org/learn/machine-learning)
Pattern Recognition and Machine Learning(http://www.springer.com/us/book/9780387310732)
Machine Learning: A Probabilistic Perspective(https://mitpress.mit.edu/books/machine-learning-1)
機器學習(https://www.coursera.org/learn/machine-learning)
Pattern Recognition and Machine Learning(http://www.springer.com/us/book/9780387310732)
Machine Learning: A Probabilistic Perspective(https://mitpress.mit.edu/books/machine-learning-1)













沒有留言:
張貼留言